100,000 Places To Park And There's Nowhere To Go
INRIX shared their parking garage data with me and I'm surprisingly exasperated about it. Or; how to read data so that it makes sense.
One of the skills they teach you in urban planning school is how to interpret very little data in many ways, to death. The more columns, the more tables, the more databases, the more insight that’s possible—and the more ways to make up nonsense.
Thanks to my friends at INRIX and thanks to the world’s obsession with parking, I’ve got some data to sift through about the world’s biggest parking lots. There’s a longer piece about the history of events and parking in here somewhere that I once tried to pitch to The Ringer, unsuccessfully, for now. I want to share a medium-sized list of insights from a two-column data set. Three variables: name, location, and number of spots.


This is an exercise in how to pair data with story to make information. With this information, policymakers and administrators can make the policy and set rules, build new things, and maintain the things we already have. Data without story is boring and story without data is babble. Lastly, for now, information without messenger is ether.
So, the hook: why do we dare about this topic? For one, parking is having a populist moment. You all know how I feel about Henry Grabar’s book, “Paved Paradise.” The climate is literally dying and it’s partially parking’s fault. Remember what New York looked like last week?
So, the question is, “Which parking lots are the biggest, take up the most space, and are outsized contributors to driving around in circles?” Reader, the table is below.
When presented with a dataset for the first time, the first step is to make sure we understand what we’re looking at. For much bigger sets, server-side tools, like Python and R, have summary and header functions that add some perspective and context. For a set this small we can just…observe it. An exercise I like to do is extract some *fun* facts about it. What stands out? What seems out of place or doesn’t pass the “smell test?” What additional questions do I have that would help to make sense of the data?
Here are a few from me:
There are 10 observations here; nine are clumped between 11,000 and 16,000. One stands out. The median number of spots is 12,300. Why didn’t I use mean?
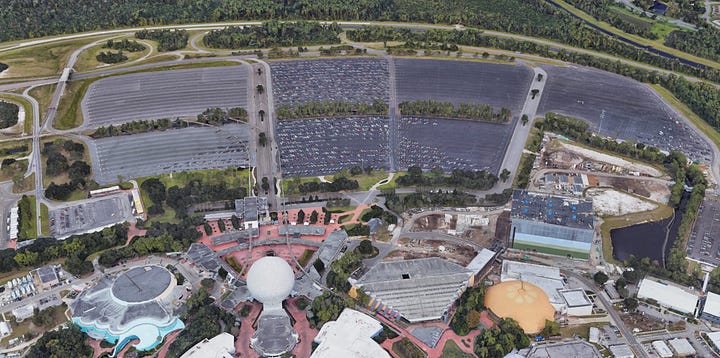
That number—EPCOTS’s 100,000 spots feels wrong? I’d definitely need to double-check this…but it is Disney and what the Mouse wants the Mouse gets (usually).
Besides the number of spots—what other factors would help contextualize this data set? I’d want to know the size of the building or attraction it serves; I’d like to know the total usage of these spaces as well. This helps to normalize the data—is 16,000 spots really a lot, or is it a lot relative to the number of people it serves?
6 of 10 garages are in the United States; 8 of 10 are in North America. This is unsurprising, given our carbrain need to park, and drive, and park, and drive, even though most cars sit empty 95% of the time.
How else can people access the attraction or space? Is there a transit or rail service? How much of the driving is compelled by public policy choice?
What’s the occupancy rate? How has it changed over time—has the space swelled or shrunk with demand or anticipated demand?
What do the next ten garages look like? Does the median drop dramatically, or does the ~10,000-12,000 spot median continue? If that’s the case—is there something to be said about the economics of the garages?
Are these garages publicly owned, operated, financed or are they privately run? Is there a subsidy? Who pays for it, how, and how is the entity responsible for this operation held to account?
When was each garage built? Are there plans to rebuild?
Is there a shared aspect to the garage—essentially can multiple attractions use the garage, or is the land use so sparse that the garage is a single-use, rapidly depreciating asset?
Is the garage free or is it paid? How does that affect operations? (Cross-reference with another way to get to and from the attraction or airport.)
How “green” is the garage? Would it qualify for the goofiest certification in all of transport (besides AICP)—LEED Platinum?
What’s the equity angle? Are these garages accessible for all people of all ages and abilities? Let’s look past the shallow questions like, “Are there elevators?” or “Are there spots for people with mobility challenges?” and leer into, “How far are we making anyone walk to get from the boonies to the attraction?”
Are we encouraging electric charging? Is the garage a destination in itself—not just for parking?
Is there housing nearby? Can there be? What’s the bottleneck? NIMBYs?


In order for me to make sense of a simple table, I’d need so much more data, I’d need so much more context to be able to tell this story correctly. Here’s what I’d need:
Zoning information—for land use and housing. I’d want any permits sought—successful or not—for building anything nearby in the last x number of years.
Occupancy data—how often are spots filled? How many days out of the year is the garage at 100%+ capacity, 75% capacity, 25% capacity?
Operating contracts and agreements—who owns the garage and how is it financed? Does the destination exist to pay for the parking? This isn’t a joke. That’s literally how the Disney Theater in Los Angeles operates.
Parking has never been simple. It’s the ninth circle of transportation planning hell. Parking is a necessary evil within the confines we’ve built for ourselves.
So what’s the narrative? Ultimately, who cares about this? Note that none of the American garages is downtown. But this data is useful in many respects, and with additional context, could be even more powerful in the fight—for or against—more parking, depending on the economics, the aesthetics, the accessibility, and the real goal: the thing itself. EPCOT’s parking garage is supposed to serve the Park. Remember?