


Okay, I’m going to switch this one up and remind my Exasperated subscribers that I actually do work and I don’t simply complain on the internet. I do that, too, but for this Mini Exasperation, I’ll share a little behind the scenes of some of the design work I do on a day-to-day basis. This week, Space Syntax.
What Is Space Syntax?
Space Syntax is the theory; Depthmap is the software. Space Syntax is a science-based, human-focused approach that investigates relationships between spatial layout and a range of social, economic, and environmental phenomena. Depthmap is the open-source tool that allows planners and exasperated laypeople to help make sense of the lines and spaces on a map.
Learning the right buttons to push is about 10% of the value and expertise you can develop with this tool—the rest is network and/or architectural drawing data prep and interpretation. In my 2+ years of learning Space Syntax, I’ve improved my:
Understanding of the value of open-source street network data and its limitations.
Ability to use CAD software to prepare and modify architectural drawings for analysis.
Communication skills to help organize science- and data-backed solutions to thorny problems whose answers are often educated guesses. Space Syntax at least provides some sense of order to erratic human behavior.
Ability to help places improve their street network design, more efficiently provide transit and micromobility services, and ensure land use and transportation are more closely aligned than they would have been otherwise.
This is a software whose outputs enhance traditional Geographic Information Systems—GIS—analysis and whose use complements traditional simulation modeling software (PTV Viswalk, Legion, Cube, others).
Space Syntax is NOT an agent-based modeling software.
Agent-based models combine enriched spatial models with behavioral object-oriented programming.1 Space Syntax is much simpler to program than a full model required for meaningful results from an agent-based model. But because it’s lightweight, the miasma of inputs and outputs needed, and how to interpret them, is much more nebulous. That’s why I get paid the medium bucks.
Instead of an enriched network and pixels to act like humans, Space Syntax is agnostic. Inputs to the software are CAD-based and can be IDd as street centerline segments.2 For example:
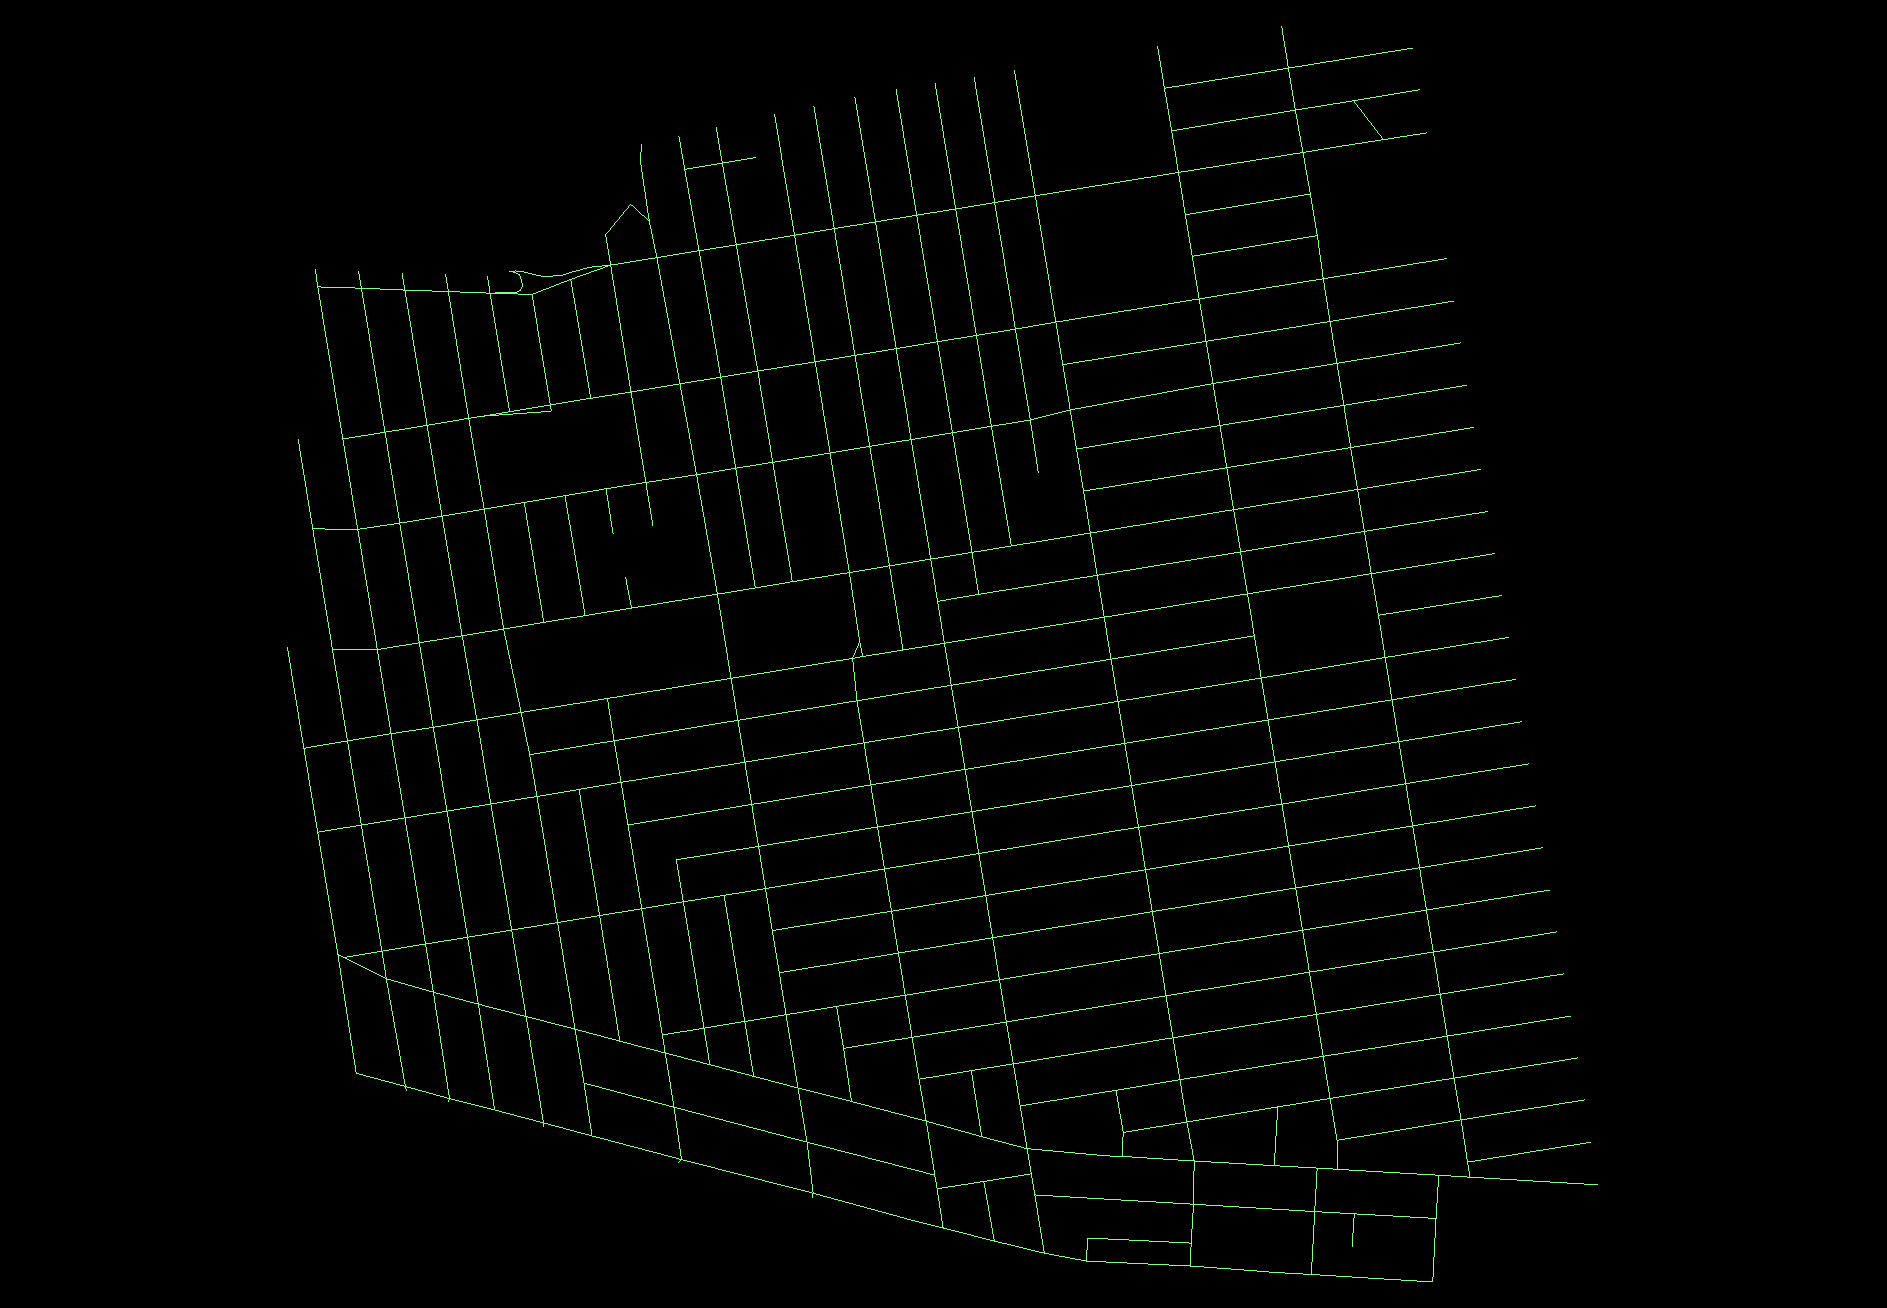
From here, there is a series of menus and buttons to press (which I’m happy to walk through if readers want it, later), to understand:
Choice: how often a particular segment would be used by any road user traveling a specific distance starting from any location.
Integration: the software can also help an analyst understand how connected any segment is to all other segments.
What does this mean?3
A Choice Example
Remember: “choice” in this context refers to a prediction of what routes a traveler will choose as they pass along or through the community along the network.


The grossly over simplified thoughts you might include in a presentation:
Observation: Certain segments—notably many of the North-South connector routes are chosen no matter the trip distance. Interpretation: It’s important to maintain throughput for all modes, but motor vehicle and bus traffic should be prioritized—new routes could be considered for the reddest segments.
Observation: It makes sense that the shorter distances are bluer / chosen less and the longer trips are redder / chosen more frequently. Interpretation: An evenly-spaced grid throughout an entire study are will likely always be blue—a traveler would be fully indifferent among a particular route. Remember, this analysis doesn’t take into account origin or destination, route preference, speed limits, and human behavior.
Observation: It makes sense that the central arteries are brighter—there are more nodes and more total possible connections. Interpretation: Compare this analysis to observed traffic patterns and enriched data—does it make sense? Are the most “chosen” routes also the most used for moving through the neighborhood?
An Integration Example
Remember: “integration” in this context refers to the relative density of the network. How relatively connected every node (intersection) is to every other node for the determined trip length.


Integration is mostly useless on its own in this context—the major interpretation is if you’re looking agnostically at building a gridded network, as you increase the length of the trip, the whole network should glow red. Integration is always best paired with land uses in a GIS to undferstand whether your network is supporting the public economics or not.
Takeaways
This post was a tremendously oversimplified basic overview of Space Syntax as a non-consquential activity and really gets at about 40% of the power of this software. Here are a few problems that I left in on purpose (I swear):
The network is likely too small for the actual area I’m seeking to analyze.
The network may or may not be fully connected. I did not check the nodal connections. The software is not geospatial and is not itself aware—nor can it be made aware—of place.
There are stray segments that are likely distorting the model. Remember (or I guess learn for the first time), Space Syntax is gravitational, meaning that it will pull choice closer to areas of complexity, or as you should interpret it, mess. A human actor won’t act like a Space Syntax output model necessarily.
I chose specific trip lengths, but did I choose the correct ones? Why not 1500m or 250m for a small network? How can I know I chose correctly?
Articles I Liked
DOT wants to prohibit free buses. That could be a problem for Mamdani in NYC. by Chris Marquette for Politico
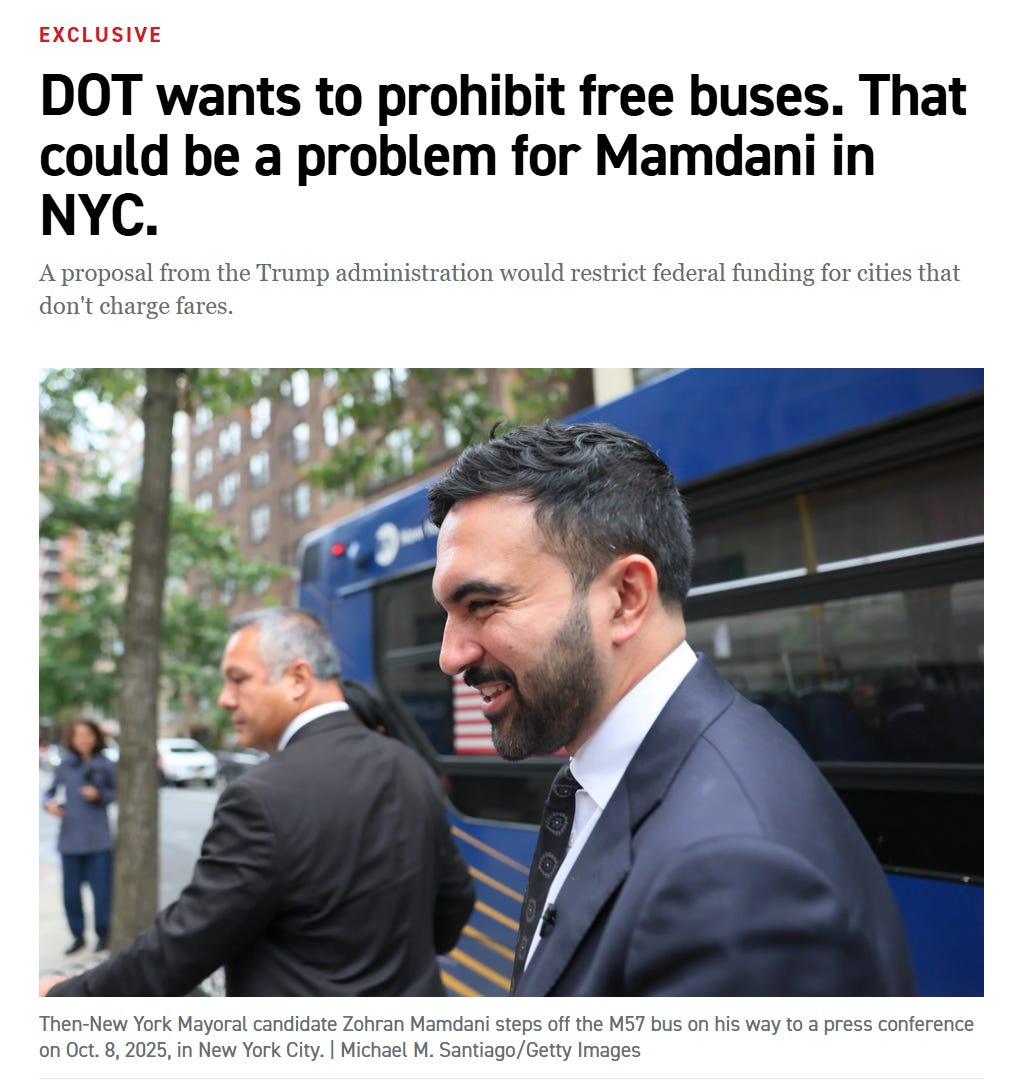
Regardless of whether you think free buses are a good idea or not, the Fed meddling in policy decisions without clear economics is more idiocy from the dumbest people who hold so much money and power. This is regulatory capture run amok and manifest in the Road Rules guy sharing a single brain cell with the President.
If I were NYC, I’d simply enroll every New Yorker in some program that qualifies them for fair fares, send an OMNY card or appropriate app (lol) upgrade. Demand-side economics mostly doesn’t work either—it’s harder to administrate and means-testing eats away at gains and can be hopelessly captured by capital—but: tourists and visitors still pay, you still get accurate counts on buses, but you lose the benefit of fast boarding.
Bus lane enforcement first, freedom to travel, also first.
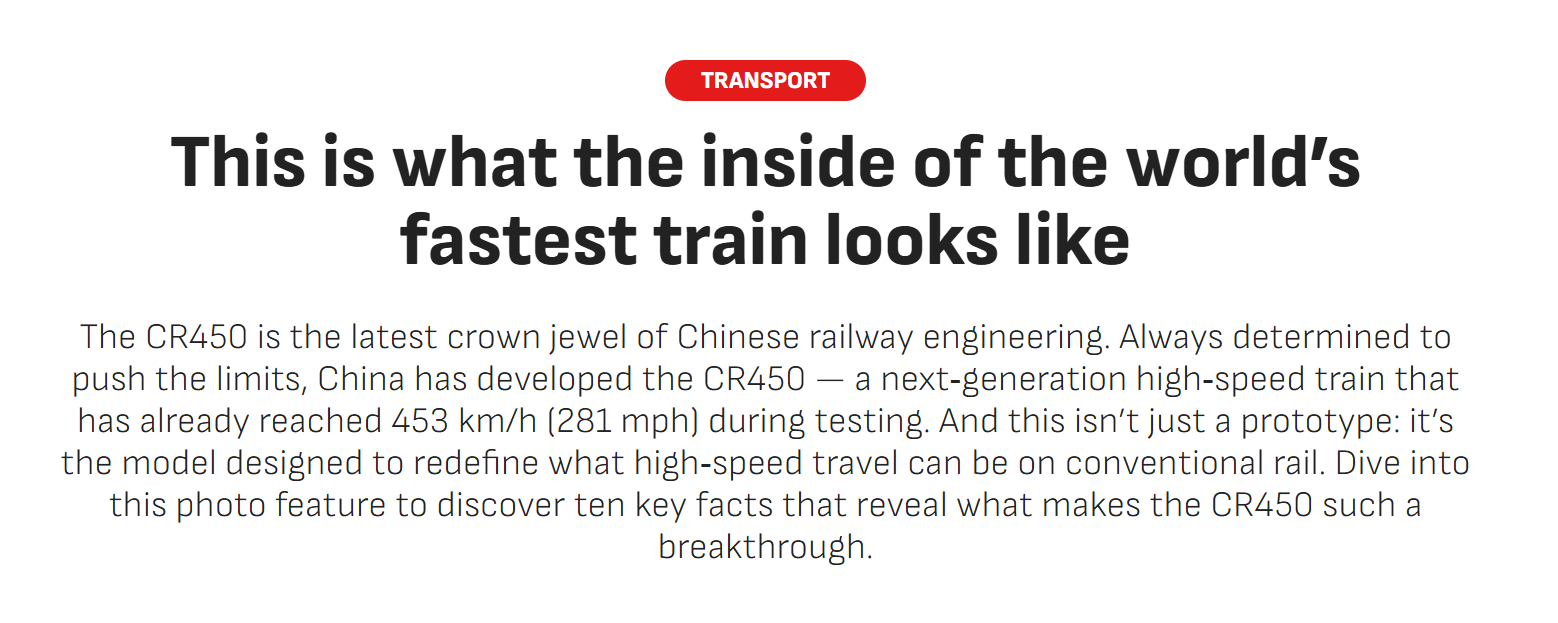
This is what the inside of the world’s fastest train looks like
Meanwhile.
Rep. Simon introduces a bill to nationalize BART’s ambassador program by Jose Fermoso for Berkeleyside
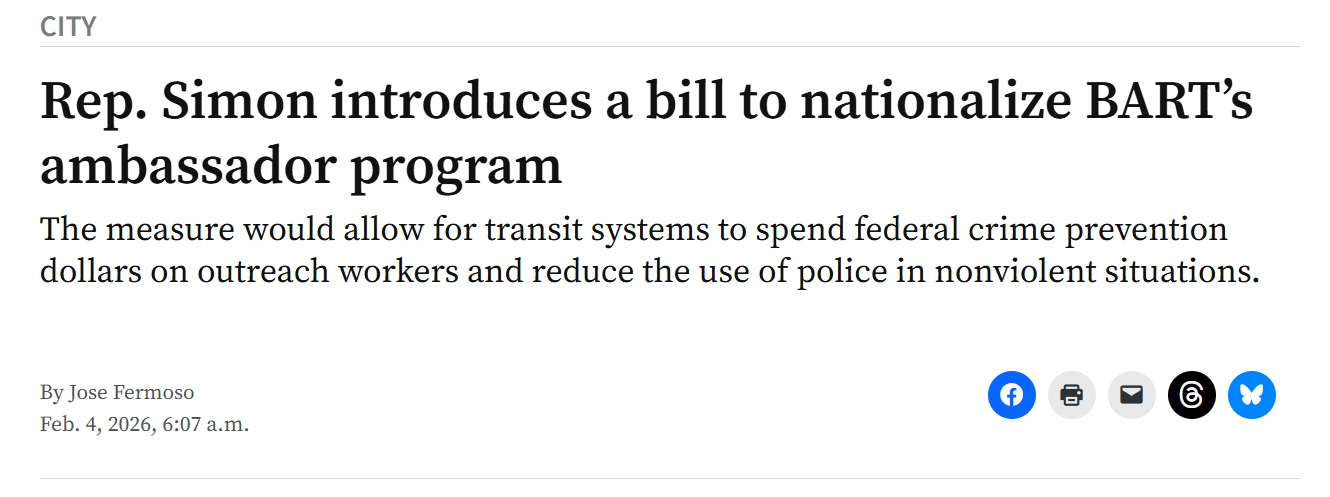
I can’t prove this but I just know Alicia Trost is behind this in some way.
Writer I Support
Fancy for: network with impedance* carries pixels programmed to behave like humans.
*Fancy for: real-world conditions. Are there sidewalks? How wide are they? Are there speed limits on connecting roadways? Are they one- or two-way? What do connections to streets look like? Are there other transportation modes that share this space or are near it? What is the network we’re analyzing? A train station? A neighborhood? Pathways in a park? All of this can be programmed into an agent-based model.
Here’s what they don’t tell you: just building this file is an annoying amount of work and will likely take you 4x as long as it should unless you’ve spent years in GIS working with decent data.
Full disclosure, I had Claude help me organize these thoughts and then I double- and triple-checked them.